Category Archives: PERSONAL
Facebook Timeline Designer Releases Reporter App
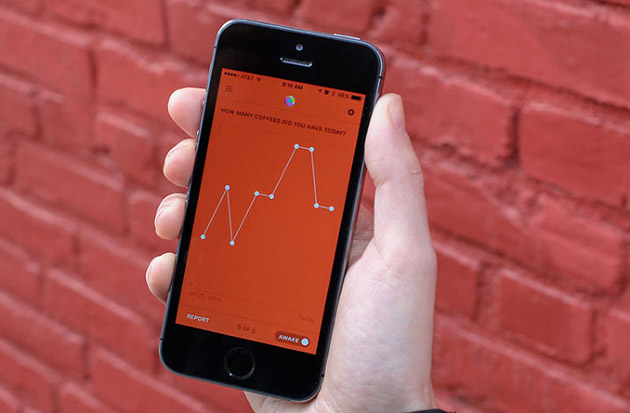
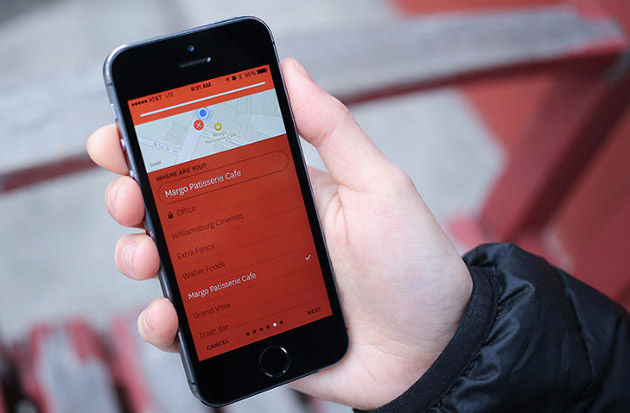
The creative mind behind Facebook‘s timeline, Nicholas Felton, has just released a new app capable of measuring your entire life and summing it up in a range of aesthetically pleasing graphs. Named “Reporter,” the app works as a survey tool, notifying the user to answer a series of questions at randomized times during the day. Default questions include “how many cups of coffee have you had?” and “who are you with?,” as well as personalized questions that can be created and answered with either multiple choice, fill in the blanks and yes/no options. Aiming for efficiency, the app is designed to ask and record your answers in less than 10 seconds, working to integrate seamlessly into your life.
Originally created as a private app for Felton, the infographic designer used the technology to track the last two years of his life. Known as the Felton Report, he then released each year’s data as limited-edition graphic prints for sale. Currently the app is more about gathering data and the curiosity that comes with it, however, ultimately its intuitive design will undoubtedly lead to merged technologies. For example, a fitness band can only monitor so much on its own, but by adding your daily food intake quickly into the app, the two can work together much more efficiently. The app will no doubt adapt and be refined once more users get on board. To purchase “Reporter,” head here.
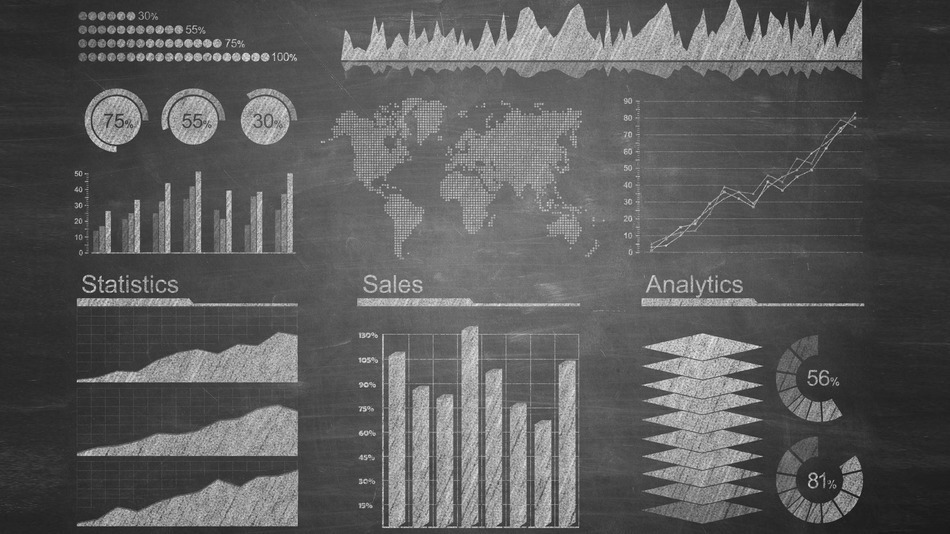
10 Web Analytics Trends for 2014
Google rolled out the Google Tag Manager to the masses and launched very cool functions such as auto event tracking.
The addition of demographic data in Google Analytics has led to amazing insights.
Adobe launched a new (much improved) interface to Adobe Analytics which showed how useful a web analytics solution can be when owned by a company that made its name with UI design tools.
Tag management companies such as TagMan and Tealium landed many great new customers as well as big rounds of funding.
With the start of 2014, we have more experienced web analysts out in the field than ever before and organizations are now relying (rather than hoping) upon analytics for improvements in their bottom line.
In the year ahead, I am optimistic that we will see the pace of advancement in the web analytics world accelerate. Below is my top 10 list of trends that I would love to see over the next 12 months.
1. Better Content Analysis Tools
When it comes to engagement with content (text, graphics, video, etc) most web analytics platforms show the same data – views, landing page visits, next page views, exits, goal contribution, etc. To get reporting on actual engagement with the content, analysts need to implement other tools to track engagement such as scrolling, mouse movement, zooming, and highlighting. This divide in reporting is a major challenge for content producers.
2. Multi-visit Click Paths
Unless you’re selling competitively priced pencils at auction, odds are that your visitors are looking at your site multiple times before (and after) converting. But today almost all web analytics platforms focus on reporting for a single visit. There are persistent tracking variables that can be used to show multi-visit attributes. But site owners need to see how visitors’ behaviors change as they learn more about products/services and as they start to interact with the organization offline (i.e. sales calls).
3. Physical Interaction Tracking
The way we interact with websites is changing. Touch screen laptops, smartphones, tablets, gaming systems with web browsers, etc all allow us to physically interact with a website. Web analytics platforms need to help us track pinches (zoom), swipes, device orientation, tilts, and other physical movements. With the current platforms tracking this type of activity requires a lot of custom JavaScript. In 2014 we want to see the web analytics tools provide out of the box tracking of this type of interaction.
4. Better Video Tracking
Sites have been using more and more video content every year for the last 5 years. But most web analytics platforms still don’t do a very good job of helping analysts understand how visitors engage with videos. There are a lot of fancy things people can do to track video engagement with integrating with players (i.e. YouTube) and custom JavaScript functions. But this level of complexity prohibits most site owners from tracking common video functions (i.e. Play). Web analytics vendors should provide better out of the box video tracking functions. It would be great to see specific video reports in web analytics tools the way we see specific mobile reports today.
5. Multi-domain Tracking
Many corporations big and small have multiple sites across multiple domains. Their prospects, customers, partners, employees, etc likely traverse across domains in multiple visits or possibly single visits. But today, most (not all) of the web analytics platforms don’t do a thorough job of enabling site owners to track visitors across domains. While this is not a problem for most site owners, for companies with diverse initiatives in marketing, demand generation, lead nurturing, and customer support this can cause a major gap in tracking the customer journey. In 2014, we want all major web analytics vendors to solve this tracking problem with easy to use configurations.
6. Compensate for “Not Provided”
As Google continues to encrypt more and more user search submissions we have seen the percentage of users with Not-Provided search phrases grow by over 100% across sites that we monitor in the last year. This makes measuring SEO performance and optimization very difficult. Analysts need Google to provide some sort of help with this. If not showing the exact search phrase, perhaps they can expose search phrase categories or better integration with Web Master Tools. It would be easy for tools like Google Analytics to create reports that show which search phrases generated traffic without associating the phrases with individual users. This would help site owners with SEO reporting without risking user privacy or website security.
7. Better Tools for Integration with Third Party Data
If 2013 was the year for “Big Data” then 2014 should be the year for data integration with web analytics. While platforms like Adobe Analytics and IBM CoreMetrics did a decent job at enabling analyst to integrate data from multiple sources (i.e. CRM, Call Center, Lead Nurturing) with web analytics data, most platforms are lagging in this area. This year we want to see web analytics platforms help site owners to have a more 360⁰ view of their prospects and customers by providing excellent tools for integrating data from other platforms into the web analytics environment.
8. CMS integration with Web Analytics:
The most commonly used administrative tool on most sites is the content management system. This is the area where people making site updates need information on how pages and pieces of content are performing and how visitors are interacting with the site. We are hopeful that some CMS vendors will make big improvements in 2014 by enabling plug and play integration with web analytics tools to empower their internal site owners.
9. Better Data Exports
Google made some great strides in 2013 to share Google Analytics data with other platforms and a large number of dash-boarding companies built/updated plugins for Google Analytics. But almost every other vendor in the web analytics space does an insufficient job at sharing data which makes dash-boarding and analyzing closed loop sales cycles unnecessarily difficult. We are hopeful that the other web analytics vendors will follow Googles lead this year.
10. Data Manipulation within Web Analytics
Platforms such as Google Analytics, Webtrends, and Adobe Analytics are great at tracking visitors and then presenting the data. But the platforms do no provide much functionality in terms of manipulating the data once it has been brought into the platform. Providing tools for editing fields and values would provide web analysts with powerful Business Intelligence capabilities to fit the tracking to the organization.
This year has barely started, but I am very hopeful that it is a defining year for how organizations worldwide gain and utilize customer intelligence in the digital channel. While few organizations fully utilize the web analytics tools they have in place today, there are progressive teams pushing the limits of what website tracking can do to improve digital experiences and I am optimistic that in 2014 the industry tools are going to evolve even farther to drive the entire web industry to new heights.
Push your limits.

Source
29 Ways to Stay Creative
29 WAYS TO STAY CREATIVE from TO-FU on Vimeo.
A short animated video that shares simple tips on 29 ways to stay creative. I don’t know about you, but I find this to be such a fantastic, easy to follow reminder on those days when I feel like I’m hitting my head against the brick wall. It really sucks being human sometimes.
Video animation by TO-FU, with soundtrack courtesy of Kämmerer.
3 Ways Big Data is Changing Fashion
Hypebeast Article –
Numbers are becoming as valuable an ally as mentors or critics are to fashion designers.
One example of a successful, crowdsourced set of opinions is fashion startup Go Try it On. The appeal of shopping at retailers still exists because there are tactile nuances that are difficult to imagine or visualize without having tried the item on. Unfortunately, it’s not always possible to go shopping with friends; this is where users of Go Try it On will chime in and give you their opinion of how you look in that article of clothing.
From a business angle, fashion companies are already figuring out clever ways to use data to grow. For example, fashion startup Everlanesuccessfully crowdfunded their expansion into Canada in order to confirm demand and gain capital.
We’re watching fashion designers make the transition from relying purely on taste and intuition to a mixing the two with business intelligence. Companies can now simply track consumer behavior or reactions to their new items, and figure out whether or not they want to bet big on a certain line. This is made possible by the development and accessibility of big data tools.
For the uninitiated, big data is when data is too difficult to track by hand, so software is enlisted to process the information. Often times, data can’t be neatly captured and entered into a spreadsheet. Data has long since been used by forecasters, such as WSGN and Stylesight; some of their clients include United Colors of Benneton, H&M, Puma, Prada, Nordstrom, Bulgari, Uniqlo, and Diesel.
Now, with big data growing more available and with different types of information being measured, designers can reap the new benefits of access to this information.
Identifying Demands more Accurately
Previously, the fashion industry was a pain for independent designers, manufacturers, and startups. Imagine this: every season, independent designers have to churn out a few sets of new garments. In a previous life, InteraXon co-founder Ariel Garten was a fashion designer; she once explained in an interview, the moment you factor in the many different variables (such as colors, styles, and sizes), you’ve easily got 20 variants of the same item that all need to be produced in a short time period.
Because smaller independent designers don’t (typically) have much leverage with retailers, they would typically sell on consignment. At the end of the season, these designers would have to take back any goods that were not sold through the retailer — which would be a waste of both labour and resources, as they are out of season.
Data collectors such as Bodymetrics are starting taking into account individuals’ sizes and body measurements, which means both designers and retailers can figure out approximate demands and create variants accordingly. Because they have the data on which sizes are most popular, they can consider this in their production process and minimize the amount of leftover goods.
Similarly, fashion startup EDITD collects data and makes forecasts in order to help designers and retailers make better decisions. Its service has a variety of sources; for example, it is one of many services that keeps its finger on social media in order to figure out consumer sentiments. This is an essential part of the feedback loop that few designers have gained true insight into, as they’ve had no option other than to rely on intuition and experience.
Gauge Fashion Design Reactions
The activity of public relations is difficult enough to gauge; media exposure in gross impressions, attitude change, or which messages were most spread the most and whether they aligned with the company’s intended marketing message. With fashion, it becomes slightly more complicated: What happens after a fashion show or an event? How is success measured?
In addition to the previously mentioned EDITD, a few newer fashion services (such as Fashionbi) allow fashion brands to gauge not only the commentary they see in expert or critic reviews from newspapers, but also the rest of the stuff that’s streaming across the blogosphere and social media.
Fashionbi specifically features a user-friendly dashboard format that can break data down into country-by-country analysis and period-specific analyses. More importantly, it presents harder quantitative data, which can be a valuable resource. The opinion of specific critics, who may not reflect the thoughts of the general public, is weighed less heavily. Tools like Fashionbi also enable designers, and larger companies, to figure out very quickly and conveniently what’s popular in certain locations with as few meetings and bureaucracy as possible. Designers can now better gauge which articles of clothing gain a more favorable reaction by which influencers or users, and style accordingly.
Creating a Better Retail Experience
Burberry’s famously digital flagship store was the first step in introducing big data into the retail environment. Not only does the technology create a more exciting and visually stimulating environment, it also allows Burberry employees to create a deeper level of service for customers. Specific items are tagged with RFID chips; these chips trigger interactive videos showing complementary items or the craftsmanship of the product in store mirrors. Mobile devices (iPads, to be specific) are used to make sales and avoid line-ups or any congestion.
For example, any employee at any Burberry store equipped with this technology can identify a customer, at almost the moment they walk in. (Scary, right?) They don’t just greet you by name, but also could inquire into whether your girlfriend liked the umbrella you bought her a couple of weeks ago. This is because, according to Forbes, Burberry ties the information it collects from store tills and iPads, and connects it with shoppers’ social media profiles. The information is then cross referenced, and forms an extremely comprehensive customer profile.
At the end of the day, where other designers are looking for big data to improve product development and manufacturing, Burberry is also using big data to enhance its social media — and to step up its customer engagement. They extend the conversation with their customers just a little bit longer; instead of getting left with a peck on the cheek on the front door, they get an invitation for coffee. That’s not to say it doesn’t leverage big data for product enhancement — they recently embarked on a campaign where the company integrates a customer’s mobile device into personalizing a product, through reading the data.
“Computing can never replace human creativity, but designers and buyers should always keep their eye on the data — there’s nothing more satisfying than creating a best-seller,” writes Vikram Alexei Kansara. It’s possible to view data as a crutch, or a distraction from developing designers’ intuitions and expressions. Conversely, it’s also difficult to ignore the opportunities that big data holds. Big data is quickly changing fashion as we know it, and it can become a powerful tool, and catalyst, for young designers to continue experimenting and pushing the envelope with. In reference to the Nike Roshe Run at the top, can you imagine a time when footwear design will come strictly at the hands of statistics rather than intuition?
THIS IS WATER (Very Inspiring)
Get your daily dose of inspiration via The Glossary’s visual interpretation of David Foster Wallace’s commencement speech to the 2005 graduating class of Kenyon College.


